
Posts by Piet van der Zanden
Readability and sightlines easily visualized with our TUDesc Application
Readability and sightlines are undervalued parameters when designing education spaces. Only rules of thumb are available, no clear definitions, but students must be able to read subject matter anywhere in the classroom. They should be able to fully concentrate on understanding the subject matter and not distracted by unreadable formulas or strained necks. That is why readability has become an important issue.
Universities start commissioning third parties to design an education building or to transform lecture halls and classrooms with clear seat capacity figures, but variables related to readability remained a bit vague. What ceiling height, or rather clear height, is needed for proper readability at the last row, at what distance should the first row start, at what height should the screen be positioned, and how large should it be for the presented subject matter?
These questions has made us writing the Cookbook Education Spaces, which has its version 2.0 to date. The cookbook shows specifications in tables with a limited number of possibilities, but inter- and extrapolating the figures seems hard when one wants to grasp readability for education spaces. So, we took the cookbook a step further, we have been making readability visible and tangible with our TU Delft education space configurator TUDesc. Try it at tudesc.com.
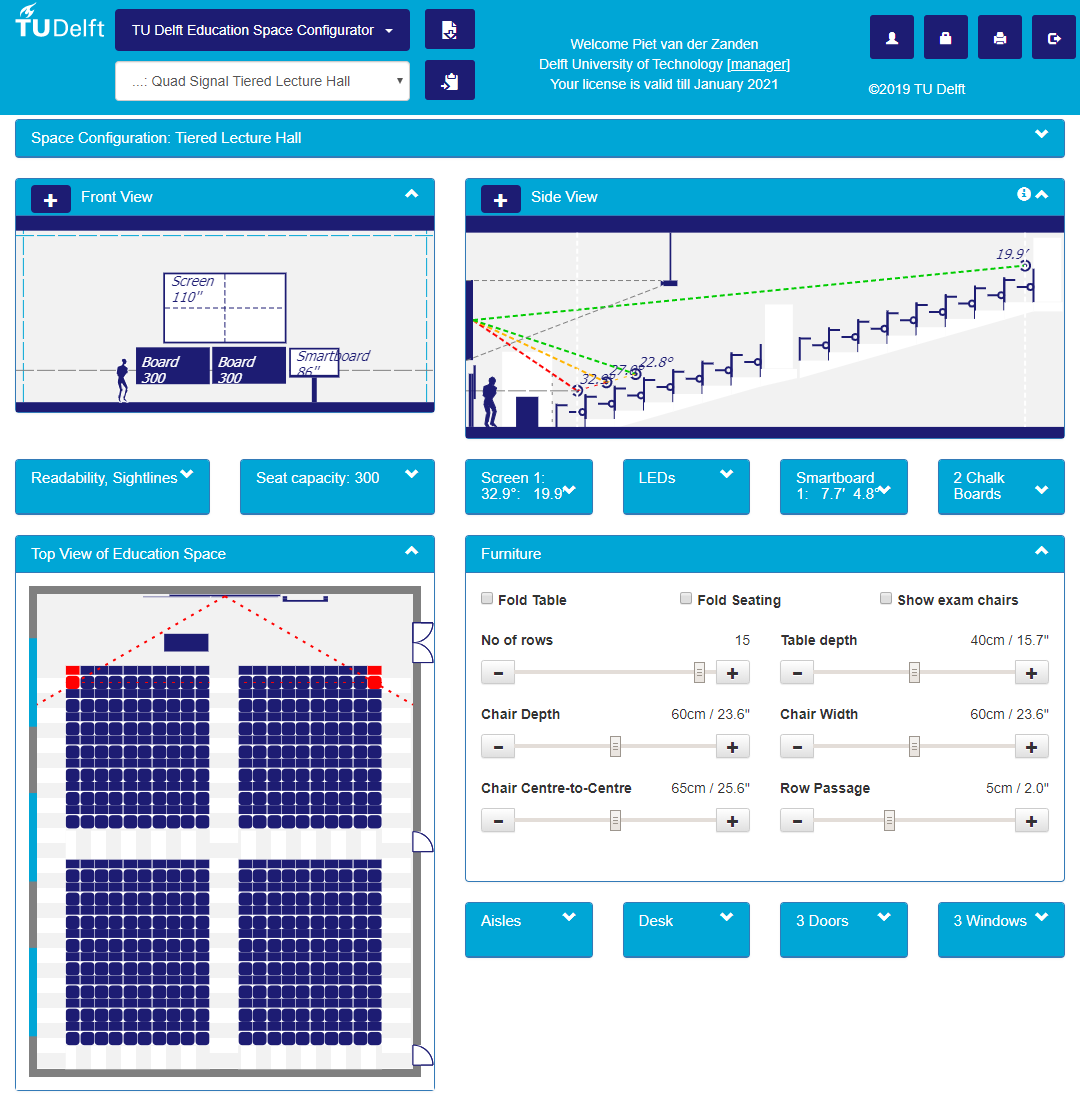
TUDesc will be released under license. Currently you are able to play around during a trial period, but you have to register. The Quickbuilder helps you with roughly setting up your first education space. Choose typology, screen, board, paths and there you go. Enter Space Name, Number and Building, and fit the dimensions to your situation … then Save As your first education space.
Now, it becomes fascinating. Change parameters (e.g., Screen Size, Floor-to-Underside, Distance First Row, etc.) to obtain a proper vertical angle at the first row and correct Readability at the last. Henceforth you may fine-tune furniture, paths, desk, doors, etc. Do not forget to save your space.
We are proud with the application as is, but of course your feedback and future use shall make us happy. The TUDesc team.
Cookbook Education Spaces version 2
Our Cookbook Education Spaces has undergone a true update, especially the chapters about Typologies and Requirements. This version 2.0 builds forth on earlier versions 1.0 (valid until February 2017) and 1.1 (valid until April 2018). Gained insights, lessons learned, and experiences with architects and builders were added to refine design guidelines and to sharpen the used definitions.
The Cookbook Education Spaces version 2.0 describes requirements for lecture halls, classrooms and study workplaces at our Delft University of Technology and contains four generic chapters: A) Pedagogic Classification, B) Education Space Typologies, C) Education Space Requirements, and D) Study Workplaces. It has been drawn up in close co-operation with teaching staff, students and supporting staff.
Simple Tool to Test Legibility in Education Spaces
Education spaces are continuously constructed and upgraded. Sightlines and readability are often taken for granted. Ever the same question occurs out of the many conversations that I have with colleagues in the field: “What should the screen dimensions be for this particular space?”
InfoComm has been publishing standards based on thumbrules and scientific foundations (ANSI/Infocomm 5M-2012). Still a simple tool would be helpful for the need of many. This Readability Tool for Education Spaces is based both on scientific figures and empirical observations, on top of that, it is easy :-).
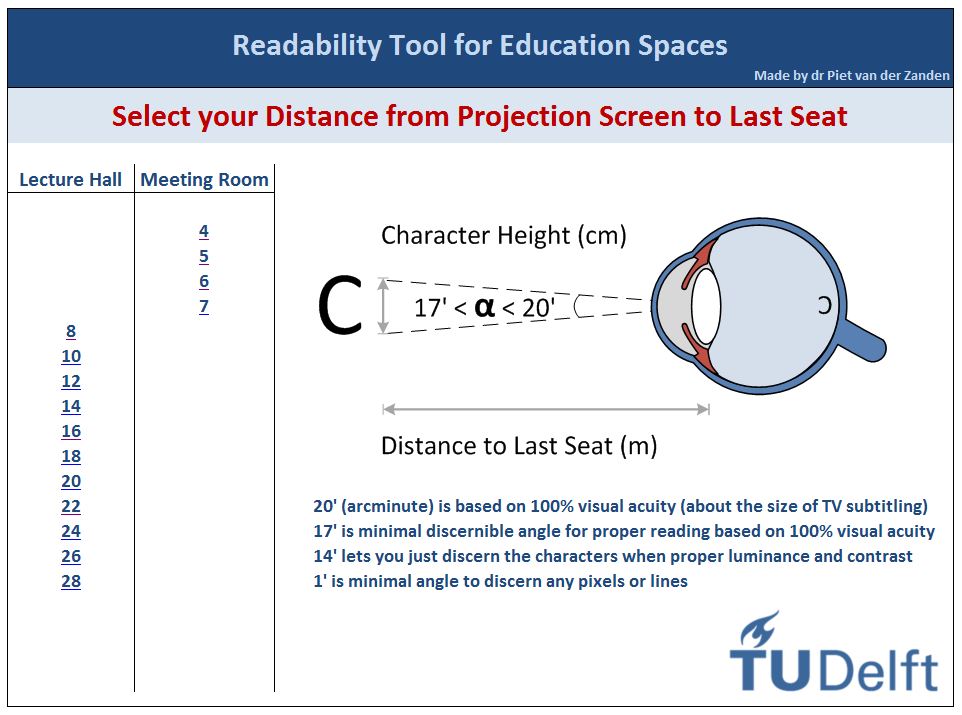 First determine the distance from projection screen to the last row with a laser measuring ruler. Open the tool from your browser, present it full screen and select the regarding distance on the main page. Be aware that the main page contains a list for lecture halls based on projectors and a list specifically for LED displays in meeting rooms. After selection you are guided to an overview page:
- On the selected page the distance in meters is presented in the top left cell
- The top row presents the minimal character height and its related vertical screen height for the room based on the minimum readability angle of 17 arcminutes. Dependent on your situation you have to multiply the screen height by either 4/3, or 16/10, or 16/9, to obtain the screen width. Then look for yourself for the next larger commercial available projection screen
- ‘Angle of view’ shows the different angles 20′, 17′, 14′ and the minimal discernible distance based on 1′
- The font Calibri 11 (default for Excel and Word) is presented with computer generated filler text, in plain and in bold. This is an unfamiliar text on purpose, for you really must read the text and not recognise word patterns
- For each angle (20′, 17′, 14′) the proper legibility distance is given
- The minimum distance for the first row is based on the angle of only 1 arcminute, because from that distance on you cannot discern pixels or lines anymore (based on full HD image of 1920*1080)
- Try to determine for yourself the distance at which you can read the text without difficulty. Compare if your own empirically determined distance corroborates with the given figures
- Repeat the same steps for Calibri 24 (an often used font for PowerPoint)
- Do some more try-outs and become acquainted with the tool
NB: The figures for LED displays are based on 14 arcminutes because legibility is better with high luminance and high contrast. Instead of screen height now the display’s diagonal is given in inches
Improved Study Results with Advanced Teaching Environment
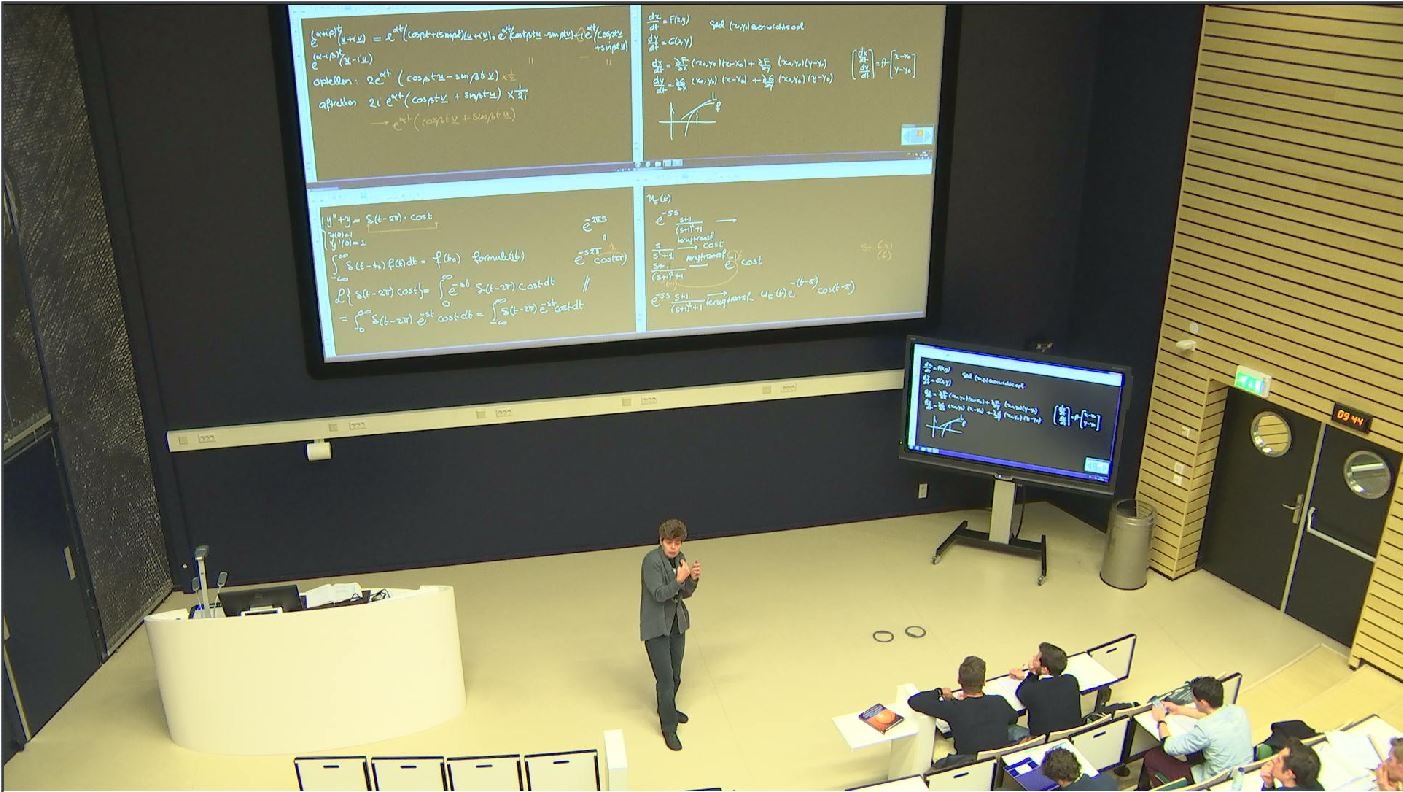
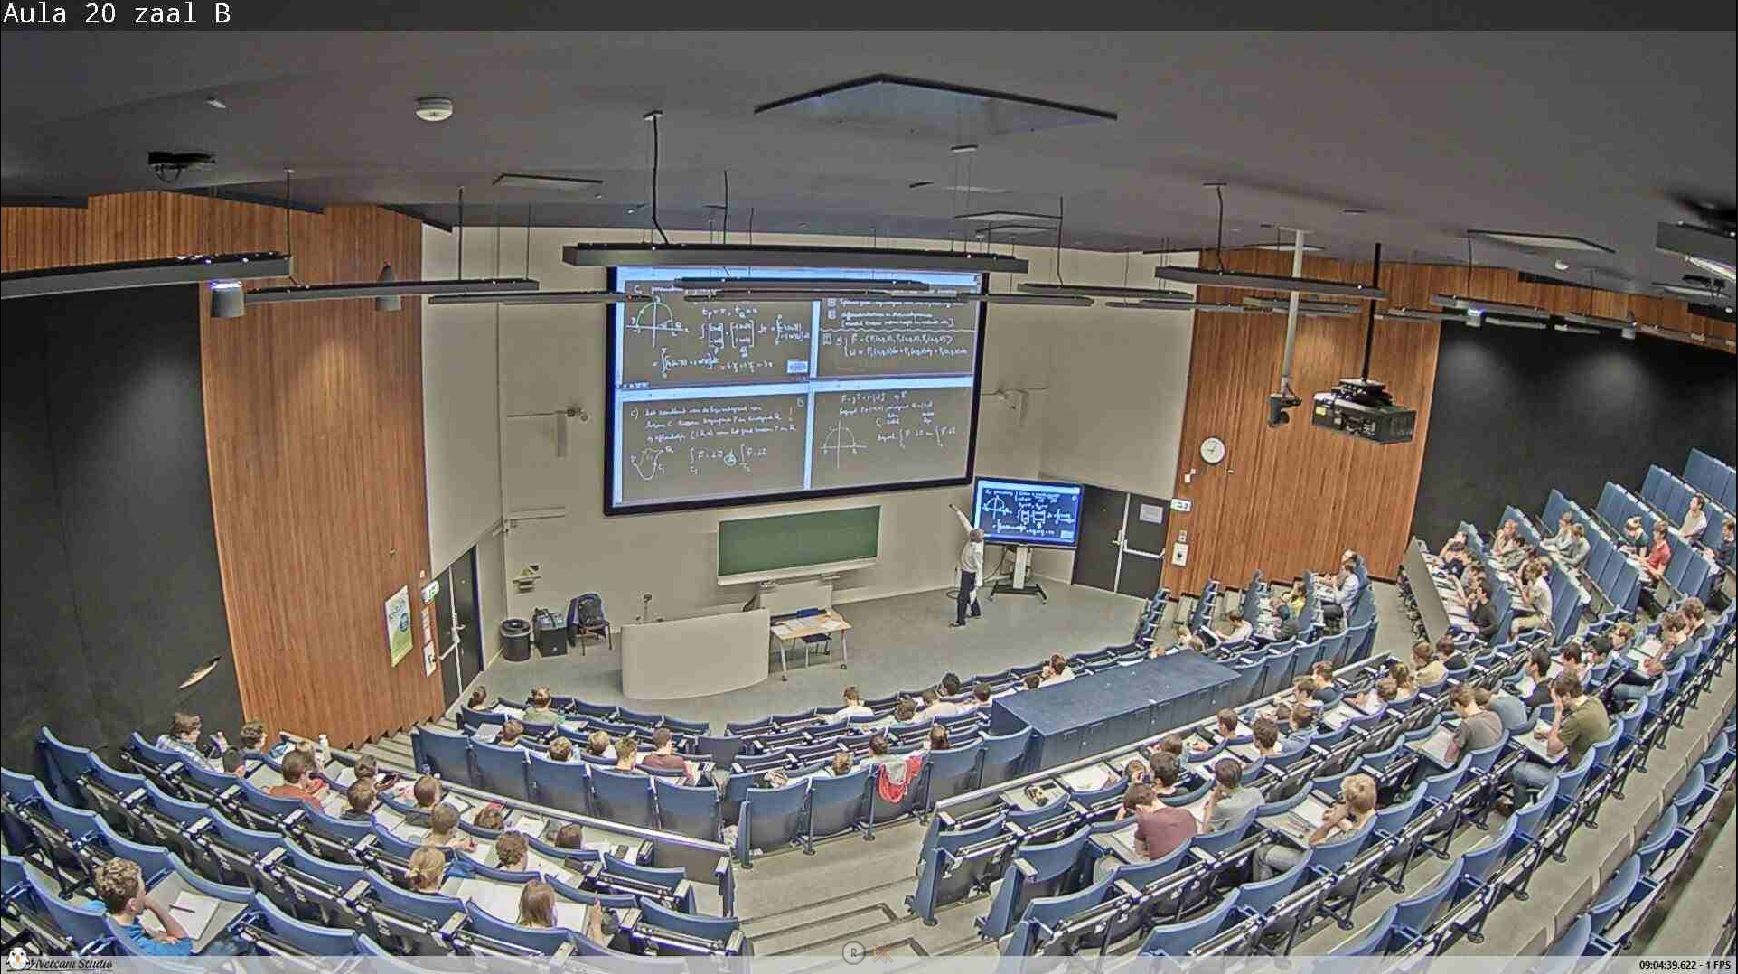
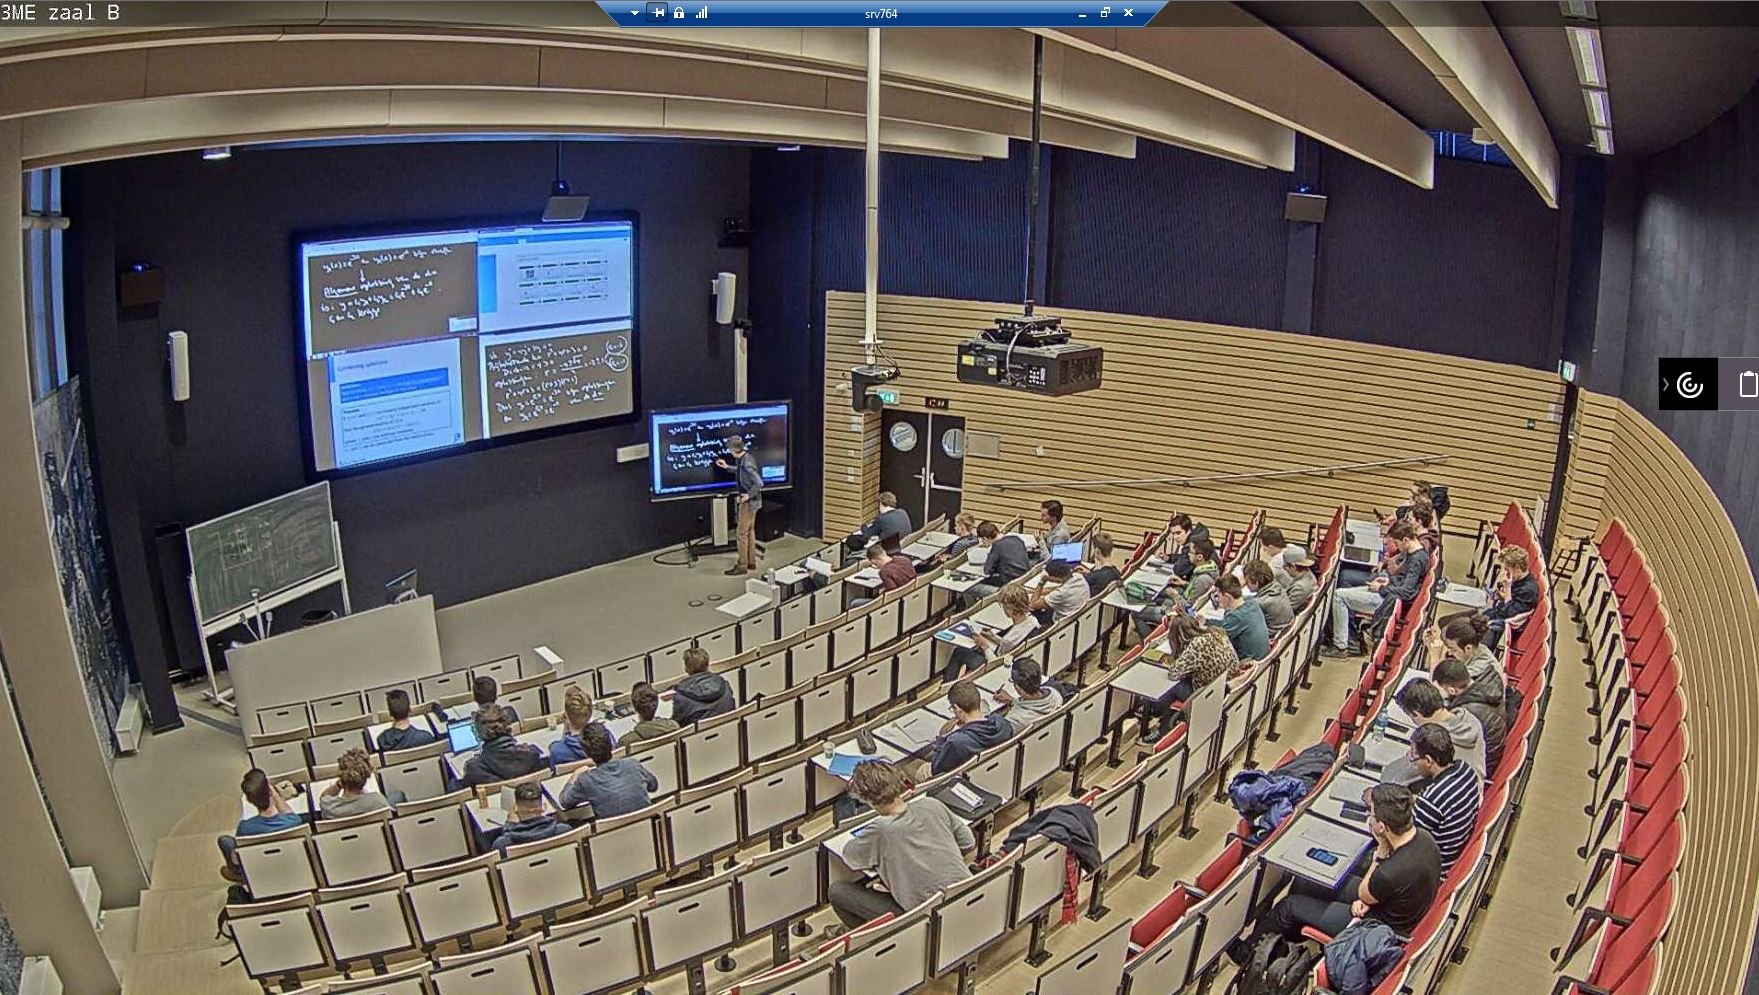
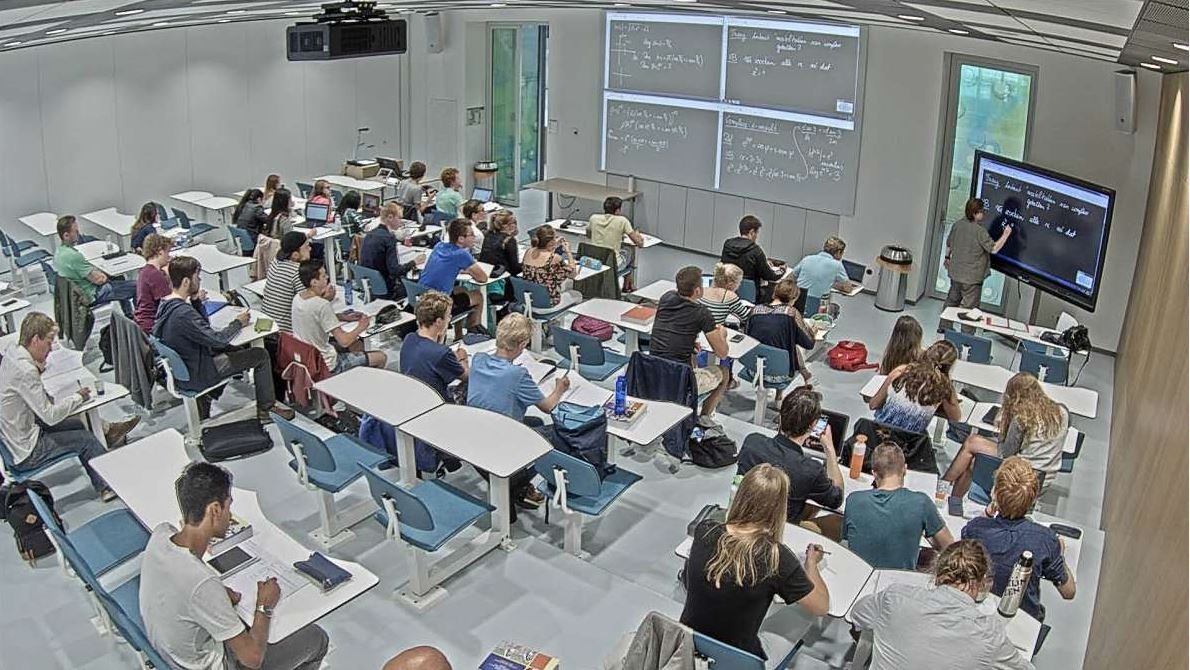
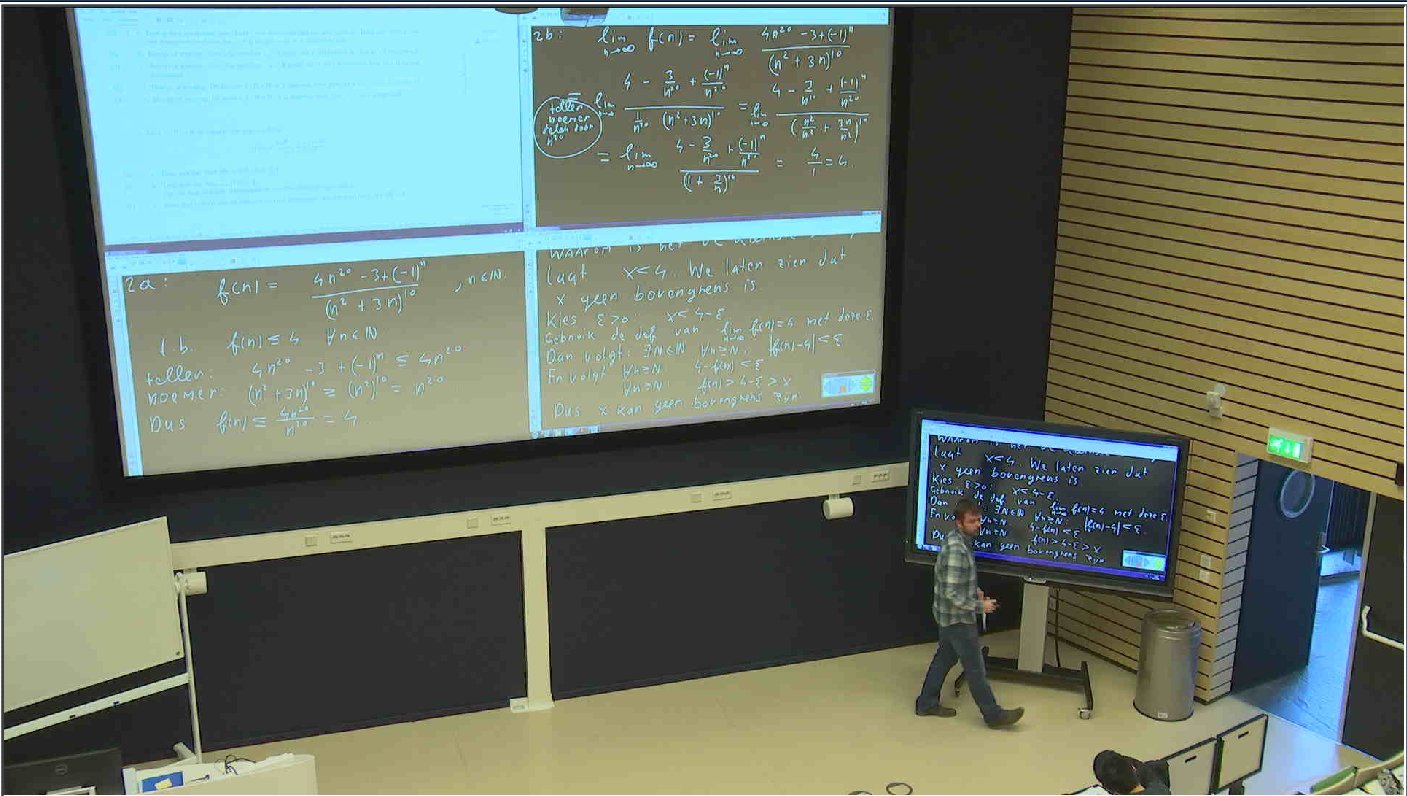
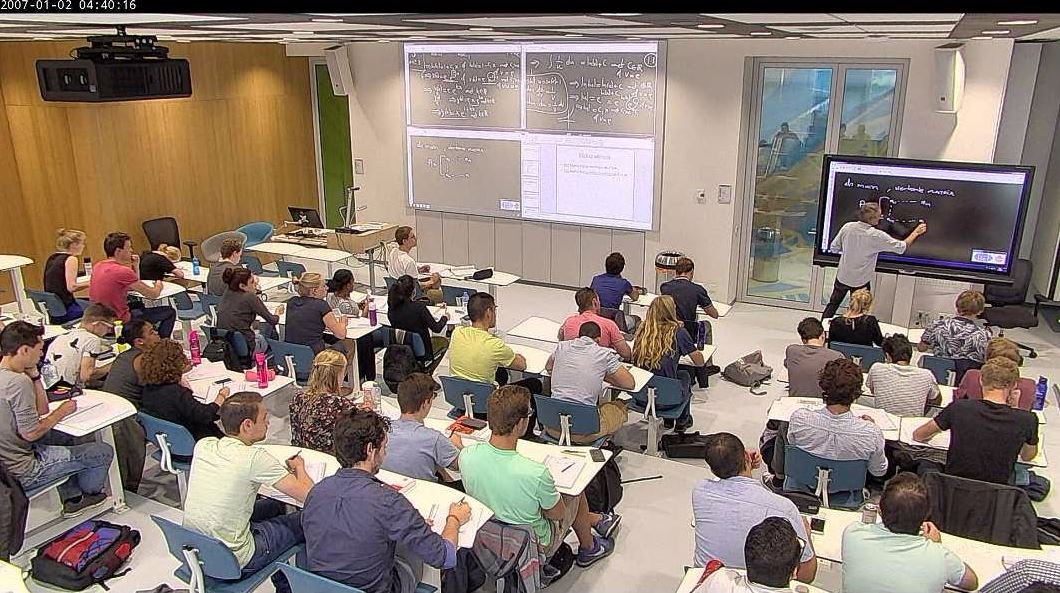
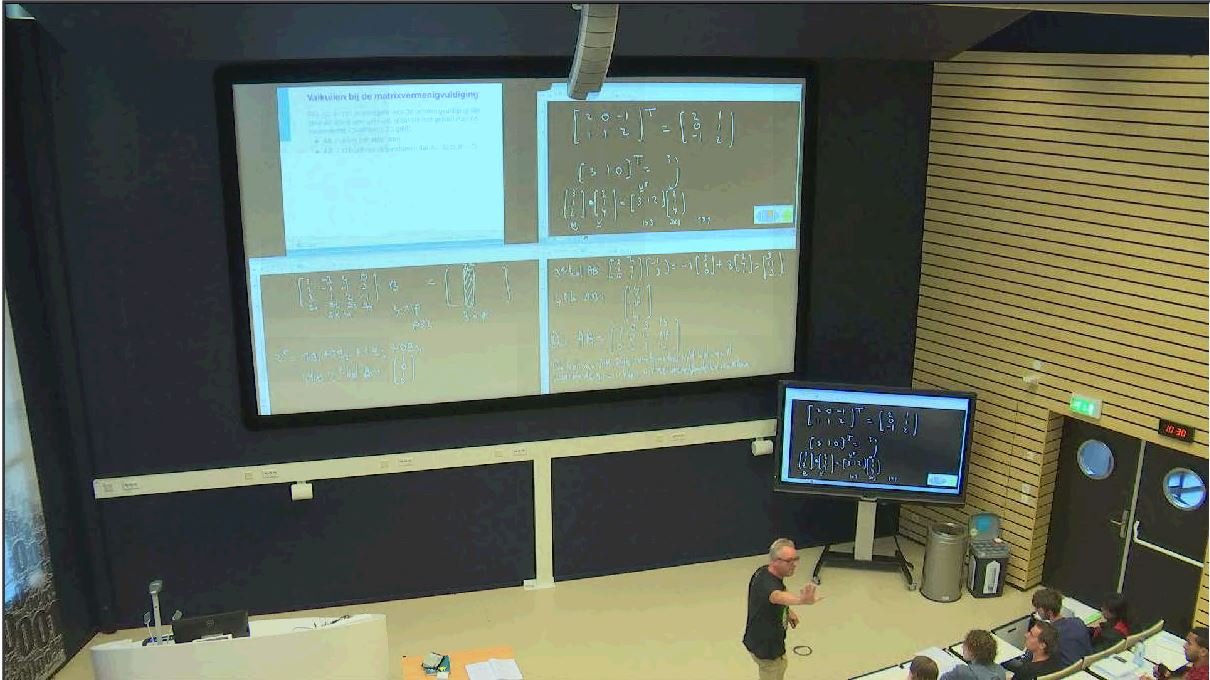
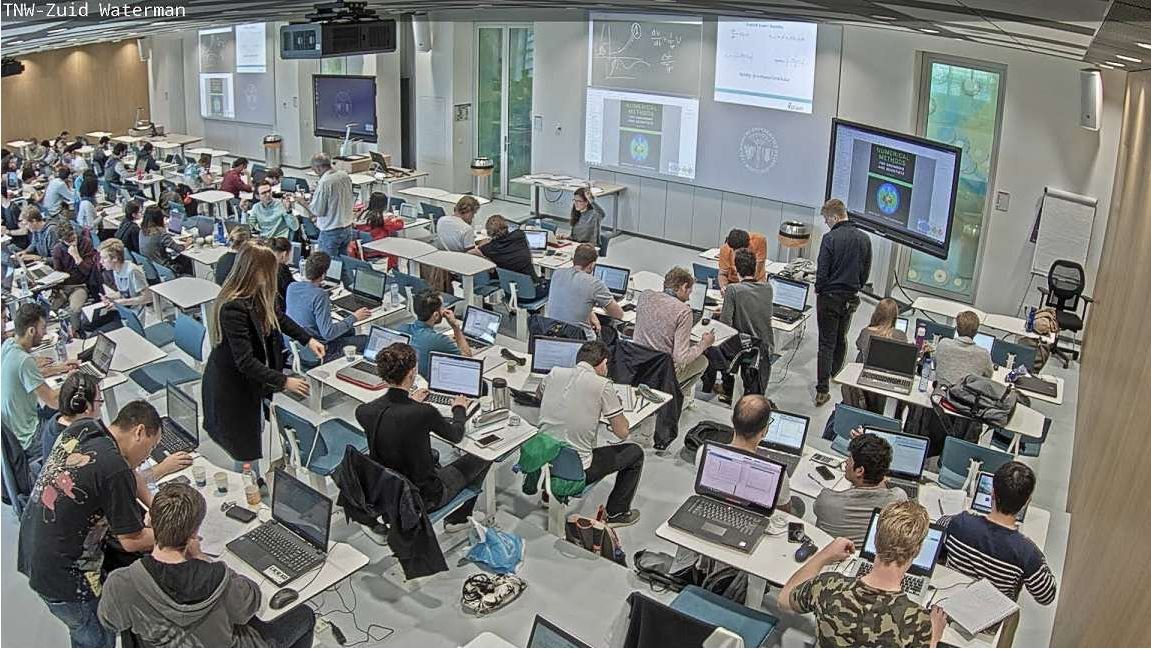
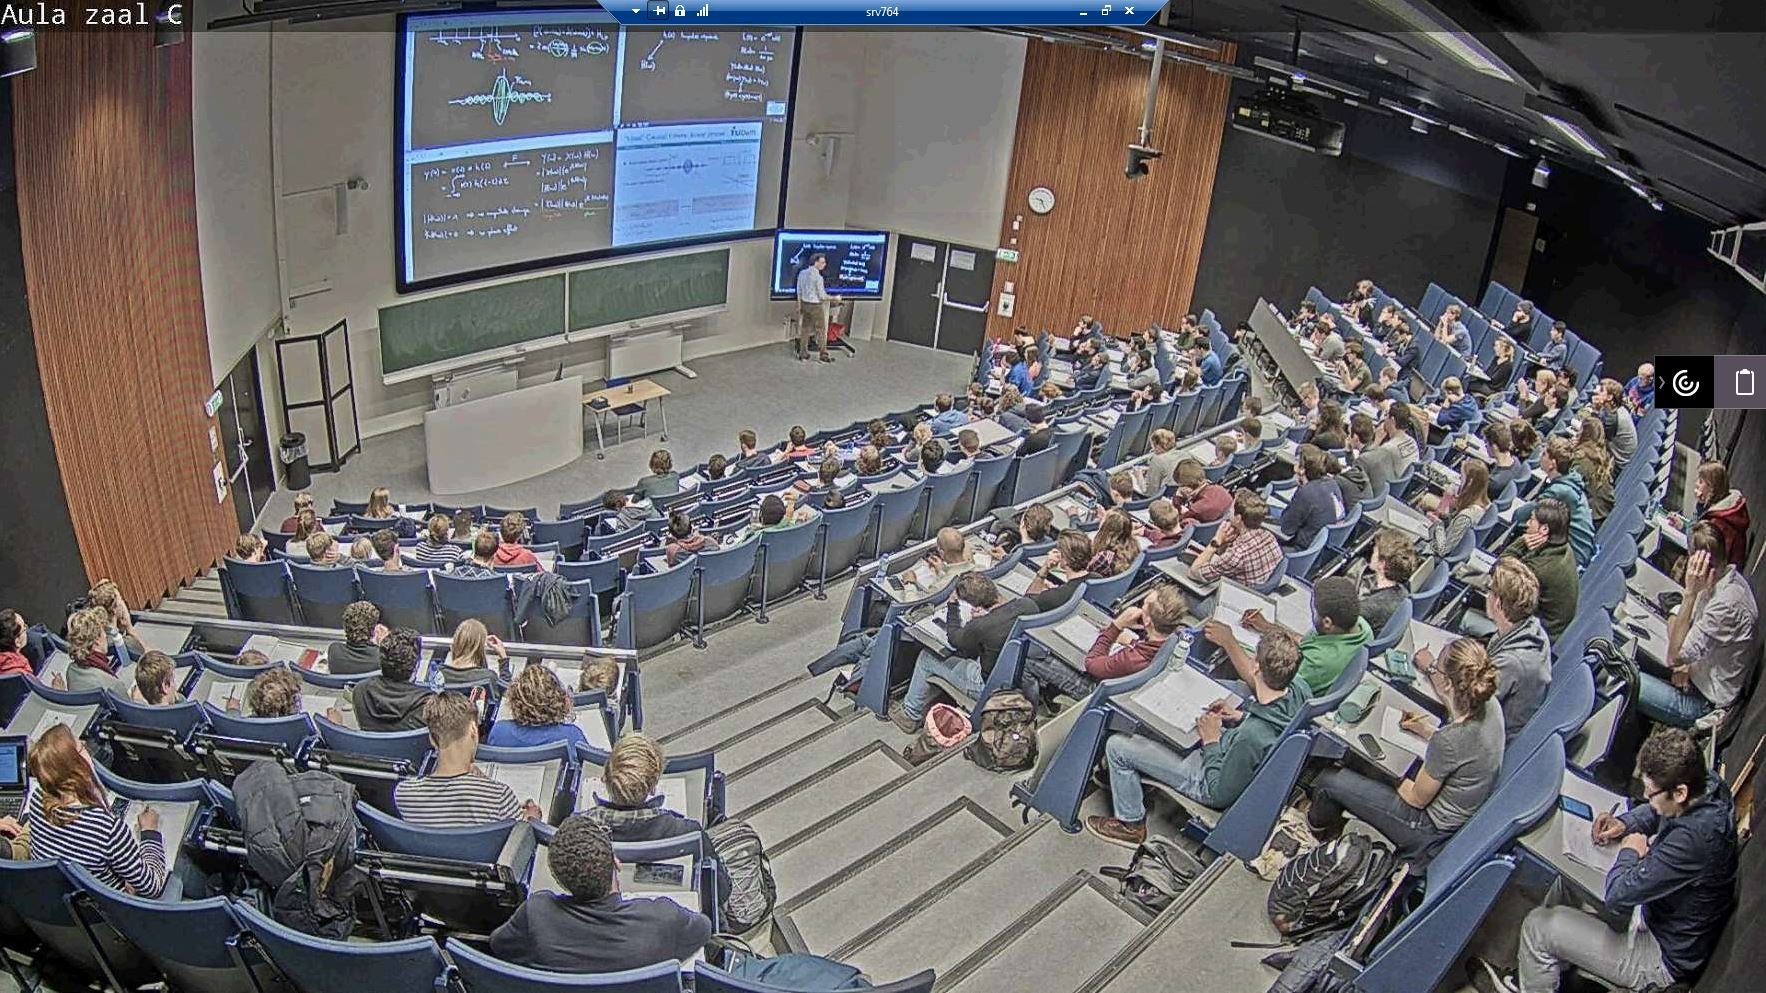
Chalkboard pedagogy is still going strong within higher education. It makes students clear how reasoning takes place instead of just presenting facts. The instructor simultaneously produce and write arguments in successive order on the board while thinking aloud. This it to visualise the reasoning, students see the process and structure of the step-by-step arguments to recognise patterns and interconnections. At the same time such talking-writing pedagogy loses connection with the contemporary but pressing movement of Open & Online education practices. The direct consequence of online practices is that all is becoming digital. Also the chalkboard should be digitised to build a bridge between campus classes, blended settings and online practices.
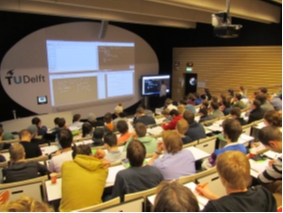
In 2012 an advanced teaching system was introduced combining virtual chalk and four parallel video signals, see earlier post on this weblog on April 17, 2014 ‘Advanced Teaching with Virtual Chalk and Four Parallel Video Signals’.
A few pictures to illustrate digital writing in its practice 🙂
 |
 |
 |
 |
 |
 |
 |
 |
 |
Students and instructors were extremely positive, but had their opinions led to better study performances? Now, four years after initiation, study results of three full academic years were analysed and have been delivering interesting results. If we compare our findings with the largest and most comprehensive meta-analysis about undergraduate STEM education [1], which questions the traditional lecturing practice, we have found very competing figures. Although four-quadrant pedagogy is new, it still belongs to what is named lecture setting. How interesting would it be when active elements are added to the four-quadrant pedagogy. Read this paper and be astounded.
[1] Freeman, S., et al. (2014). “Active Learning increases student performance in science, engineering, and mathematics.” PNAS 111(23): 6.
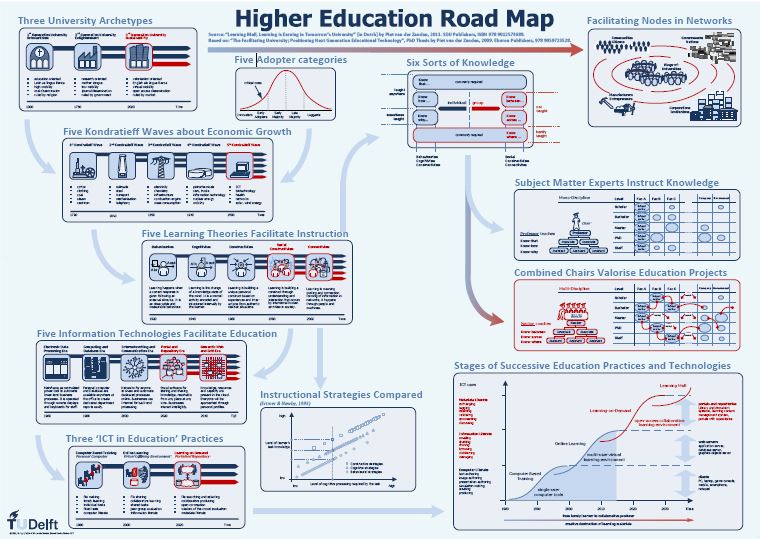
Infographics Higher Education Roadmap
I have read lots of literature for my PhD. Many books and papers delivered pieces for a greater puzzle that have set itself into my mind. Only after restructuring the multiple chapters and sections of my thesis at the time, this puzzle became outlined on paper. Today, I still use parts of it in discussions and presentations, which gives me hold to where we stand within higher education.
I have decided that it has to be shared in the form of an infographics poster on which several timelines are presented. Blue is already realised, red is still to come. As a consequence of all influences for higher education I could only conclude that money has to be earned to survive as university. Such should lead to a structure that is able to exchange knowledge from education projects for hard currency. I think one way to do that is valorising students’ knowledge through collaborative education projects, be it tangible or academic. The instructors for such multidisciplinary projects are themselves bridge-builders. Hence I call them nectors from the Latin nectere meaning to bind, to bond, to link. Their chairs are combined into a bench. Anyhow, enjoy 🙂
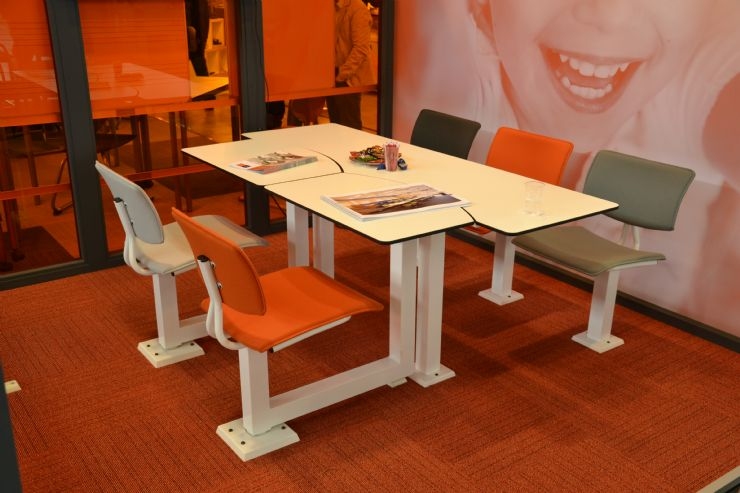
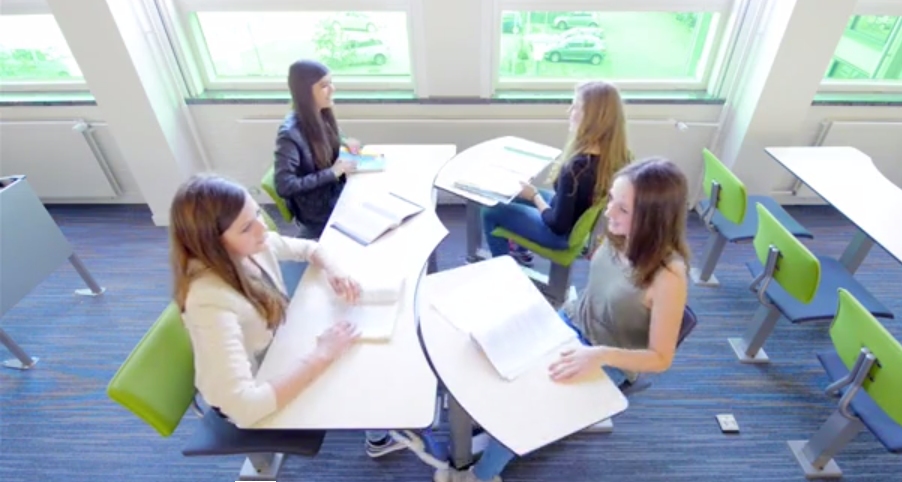
New Revolving Furniture for Mixed Practices and Interactive Classes
Since the last decade interactive classes and flipped classroom pedagogies came into higher education. These pedagogies prefer convertible settings, i.e. frontal instruction and group work within a single space. Easy change of tables and seats and especially preventing messy arrangements in the classroom were challenges for an industrial design master assignment.
A first prototype was designed in 2010 by master student Timo van de Kreke in cooperation with manufacturer EromesMarko in the Netherlands. Two years later the prototype was converted into a null series with two possible models for further evaluation. Meanwhile several improvements have been made for the 2014 production series. Developments are described in more detail in this paper.
Readability in Classrooms
It should be compulsory that written and presented information in classrooms and lecture halls is easy to produce by the lecturer and easy to read and follow by students. It may be of no difference for readability that written or presented texts are projected on dry eraser boards, on projection screens or on electronic displays. Readability of written and presented characters in lecture halls and classrooms is dependent on sight lines, reading distance, character heights, viewing angles, displays, screens and lighting.
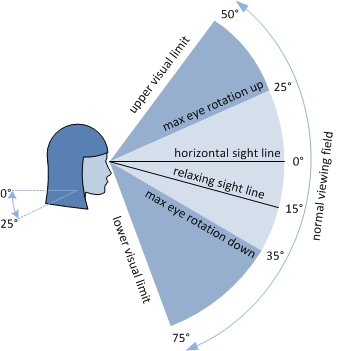
Vertical Viewing Field of the Eye
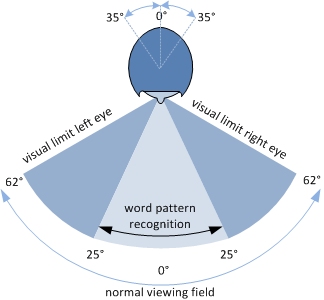
Horizontal Viewing Filed of the Eye
This paper describes guidelines from out of ergonomic, didactic and audio-visual perspectives for an improved readability in lecture halls and classrooms. It ought to be conducive to the building plans used to construct new education spaces or when renovating lecture halls and classrooms.
Readability guidelines:
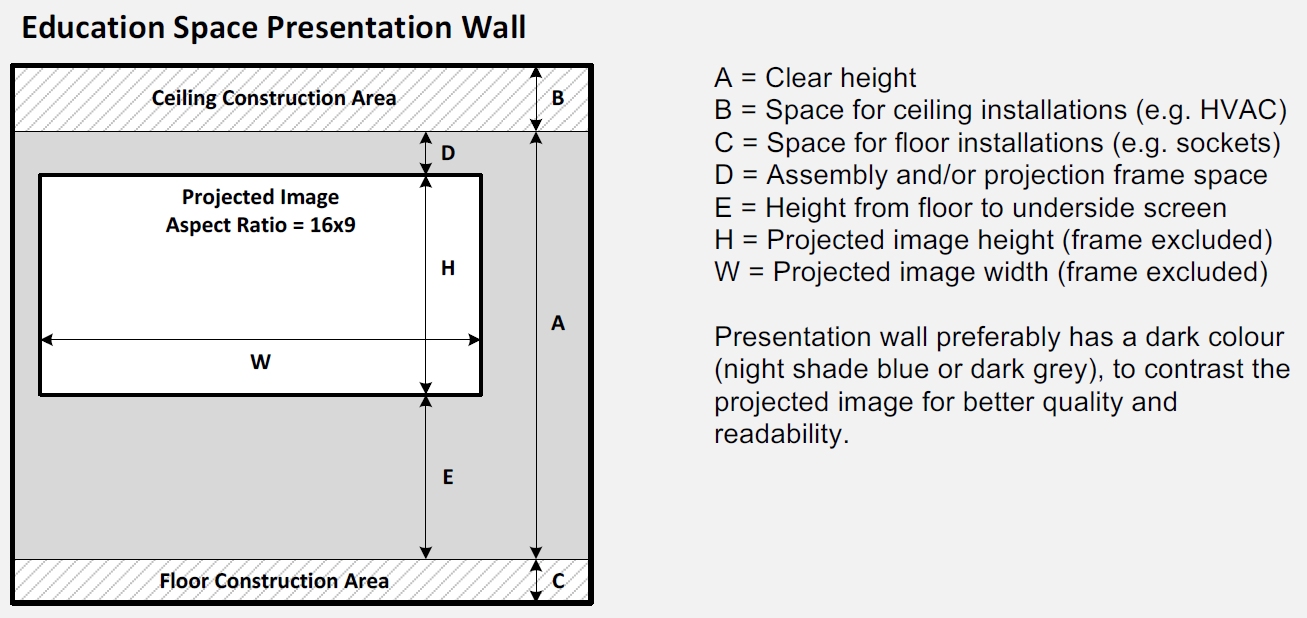
- Presentation screen’s underside preferably about 140 cm above floor level
- Vertical viewing angle at the first row preferably about 25 degrees
- Horizontal viewing angle at the first row preferably about 35 degrees
- Written and presented character height preferably about 20 arc minutes
- Written characters preferably presented white on a black background
- Projector’s illumination preferably about 1000 lumen per m2 of projection screen
- Projector preferably back projection, prevent hot spot or reflection in case of front projection
- Brightness of LED display preferably 2000 nits or more
- Pixel density of electronic displays preferably larger than 30 PPI
Advanced Teaching with Virtual Chalk and Four Parallel Video Signals
At Delft University of Technology a pilot scheme has been launched in April 2012 to introduce more advanced technological tools for teaching mathematics and other technical-scientific subjects. A virtual chalkboard was integrated with an Audio-Visual Information Technology (AV-IT) facility to present four video signals simultaneously. These video signals are for example PowerPoint, virtual chalkboard instances, PDF documents, Internet Explorer or video clips. Students watch all video signals at once to get a comprehensive overview of the method being taught.

In spring 2013 I have presented the paper “Advanced Teaching with Four Parallel Video Signals” at the 7th International Technology, Education and Development Conference in Valencia in Spain. It was based on early experiences.
Meanwhile a total of eight evaluation periods have been taken place. Hence I have been revising and expanding the paper, which describes the collected results of 457 completed questionnaires and 238 students’ comments.
Both lecturers and students are enthusiastic and prefer the SMARTboard with four quadrants over the old-fashioned chalkboard. Such encourages us to provide more lecture halls with a similar system.
Recent Comments